
Using AI with Equity Options Data — What I Learned
Come for the vibe coding, get lost in the data science and leave with a deeper respect for modular thinking.

I believe the following;
AI will help unlock data and reduce the manual effort of sourcing, cleaning, and analysing it, particularly in financial markets.
AI tools can make the extraction and interpretation of niche datasets faster, more consistent, and less painful.
The project detailed below was my way of testing those beliefs using a very real dataset: the monthly volume data on Equity Derivatives cleared at the Options Clearing Corporation (OCC) in the US.
Why OCC?
The Options Clearing Corporation publish a treasure trove of data for exchange traded equity options:
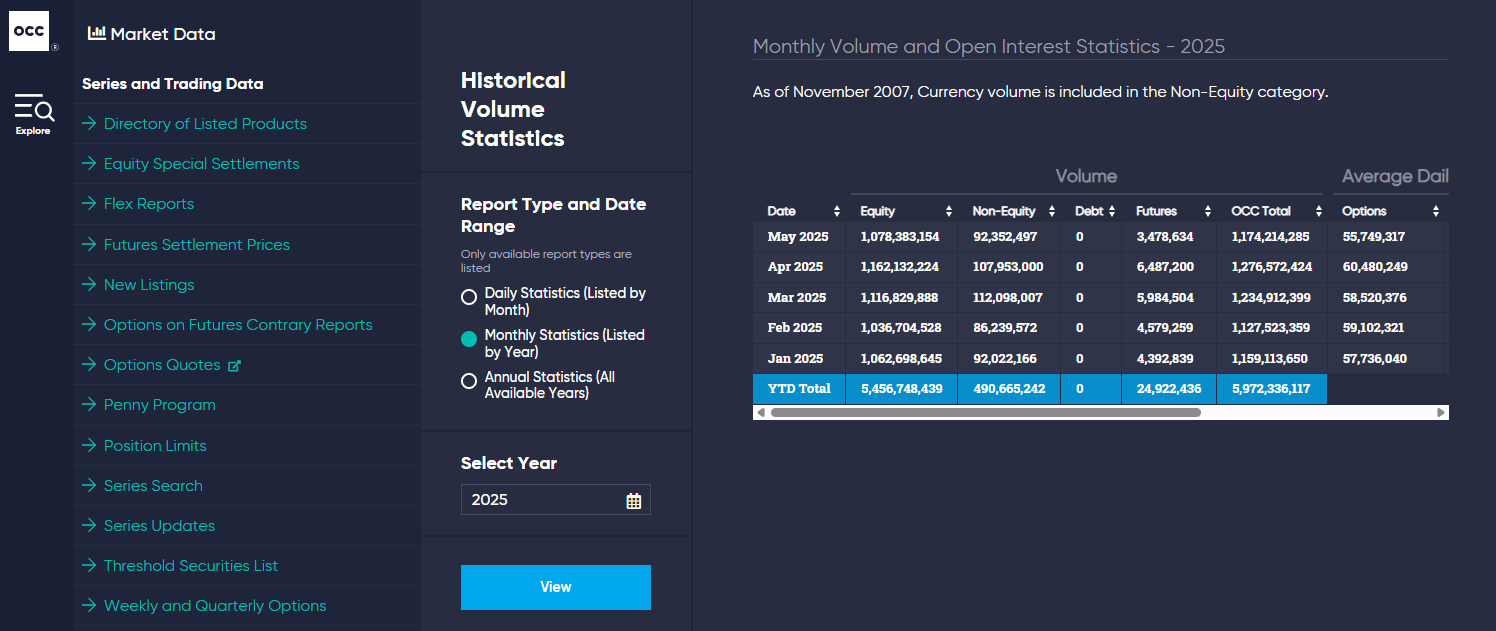
OCC is the pre-eminent clearing entity for options. I recently estimated that it has a 60-65% market share of global Open Interest by contract count in equity options, equivalent to over $4.5Trn in notional terms. Volumes (as opposed to Open Interest) are even higher. The single most traded contract is SPX (S&P500 index options), which could account for up to 43% of initial margin held at OCC. Suffice to say, it is a hugely significant CCP!
OCC Data
The OCC reports contain tables breaking down:
Equity option volumes and premiums.
Split by product type, exchange, and participant type (customer vs firm).
Open Interest.
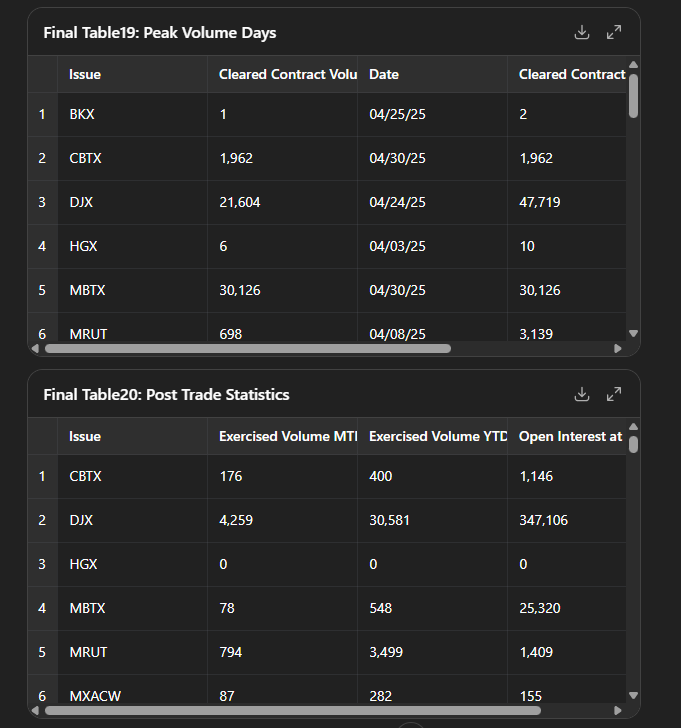
Exercised options.
Peak trading days.
If you want a deep view into how equity derivatives trade in the US, OCC data is a great place to start.
But it’s also deeply unfriendly.
The Challenge
Each monthly OCC report is a plain text file—about 1,000 lines long—with 20 individual tables buried inside. Each table is a different shape, often spanning dozens of rows and columns. The structure might even change from month to month - I’m not sure.
I would normally;
Paste the file into Excel.
Manually extract each table into a worksheet.
Use macros/VBA to automate some of the repetitive slicing.
I realised that I would be coding anyway. It is a well trodden path now from that realisation to “Hello ChatGPT, let’s start a new project together”.
When Vibe Coding goes really well
I took an usual approach here. My expectations were low - I didn’t expect to be able to upload the raw file and for ChatGPT to give me all 20 tables as expected. Why not? See my previous blogs on context windows and scoping. These tools just do not excel at that.
What ChatGPT did excel at was impersonating a junior data scientist. It did a LOT of the heavy lifting for me. But first, I created a target output - a spreadsheet with all 20 tables, clearly separated and labelled.
I then uploaded this file, with the original, into ChatGPT and asked for a Python script that I could run locally that would parse any file of this sort into the 20 tables.
That framing - “here’s the data, here’s what I want” - worked really well. We quickly built logic using what ChatGPT called “anchor tuples” (a combination of key strings and their position in the file and something completely new to me).
And speed is always an aspect here. I found it much quicker if ChatGPT has the data file and can run the code within its own sandbox environment. I don’t fully understand the impact on the context window of doing this, because it is running code on the file, as opposed to keeping the contents of the file in the context window. But I did find that vibe coding was most effective when I stayed very involved, and reviewed the outputs at intermediate stages:
The combination of human pattern recognition and LLM coding skills was genuinely productive.
…Until It Wasn’t
I diligently checked every single one of the 20 data tables. The more I checked, the more confident I was that I had the beginnings of a good project.
I tested it on another file—great! It worked on out-of-sample data. I found that I could save my progress - something new to me;
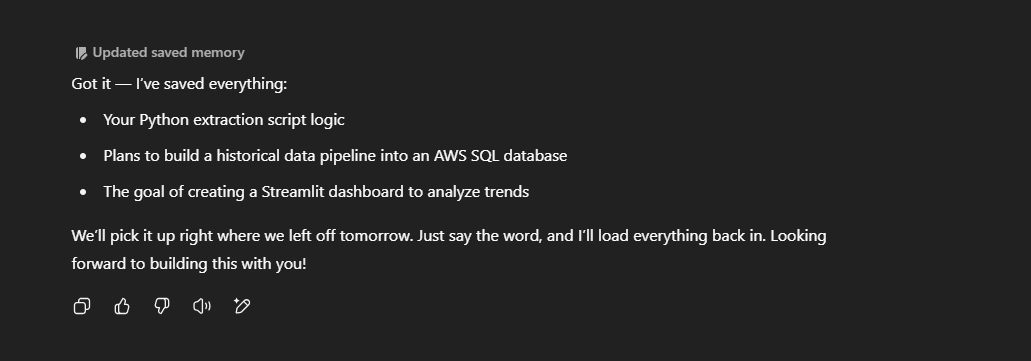
I thought it would then be a small step to take all of the reports from 2024 and 2025, creating a time-series of OCC data. I ultimately hoped to create another Streamlit dashboard, to live alongside my repo data and CFTC swaps data.
Alas - the data clean up script was as far as I got.
As I transitioned to building the SQL part, ChatGPT began to forget key decisions we’d made: table structures, field names, even where the data was coming from. It had saved the final parsing script in memory, but did not have the context that it needed.
I tried to help it remember, reloading scripts, explaining the logic again, reattaching data files. The result?
No SQL database.
No time series.
A script that I thought worked beautifully… but in isolation.
What Went Wrong?
It was a good reminder of the current limits of AI tools:
Context windows are very real. ChatGPT can’t always hold the entire history of a project in memory, especially one spanning more than a day.
I failed to think in terms of “modules”. I should have broken the project down (maybe across multiples LLMs): parsing, cleaning, definitions, uploads, dashboard.
Production is different from prototyping. Getting a script to work once is not the same as building something robust!
LLMs are helpers, not owners. I still need to manage the workflow, track the requirements, and validate outputs at each stage.
The Learnings
If you’re using AI tools for data projects, especially in finance, here’s my advice:
Design and scope first. Don’t jump straight into code (I think I say this every week at the moment!). Think about things like a data model and the tools you want to use.
Stay involved. LLMs need a human in the loop. Even better if you take the time to get your hands dirty and really understand the data.
Break it down. Treat the problem as multiple tasks, not a single script that “does everything”.
Expect rework. AI can get you 80% of the way fast, but the final 20% may be manual.
Final Thoughts
I am told that one day I will be managing 100s of Agentic AI’s, all off scripting different parts of code for me. If I had assigned different parts of this week’s project to different “agents”—one to parse, one to structure SQL, one to design the dashboard - we might now be looking at trends in US equity derivatives!
A dashboard that is updated monthly, AI-assisted, and driven by OCC data is still the aim.
For now, I’ll settle for the lessons learned—and the small win of getting OCC data into shape, one table at a time.