
Repo Clearing: LLMs vs Excel vs Python
How much of the Gilt market is cleared? ChatGPT won’t give me the right answer — but it gets me to a better one, faster.

I’ve always thought of myself as a researcher — I like digging into datasets, spotting patterns, and making sense of markets. For years, Excel was my weapon of choice. But with the ubiquity of AI tools, it’s time to ask: can ChatGPT help me do better research?
To find out, I used a real-world example that I thought would be simple enough:
How much of the Gilt repo market is cleared?
Repo Clearing
Risk.net recently ran the following story:

Good story, but I want some data:
How much of the gilt repo market is already cleared?
Who offers clearing?
How big is the market?
Where are the trend charts?
You get the idea. I need a market summary, grounded in hard data. Is it available?
🔎Step One: Ask ChatGPT
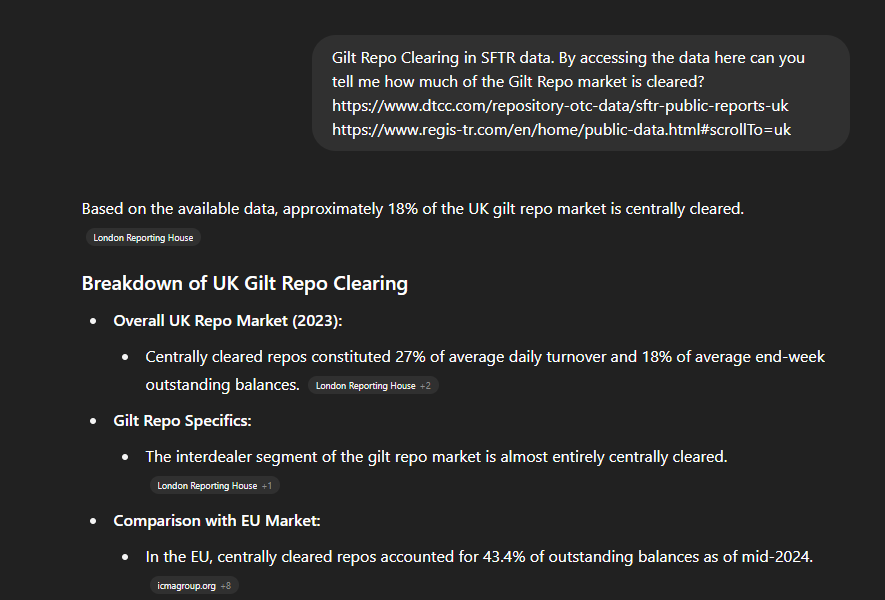
Can ChatGPT answer what feels like an innocuous question — How much of the UK Gilt repo market is cleared?
Everyone’s favourite Google-replacement gave me a reasonable response. But it ignored something critical: I already know where the data lives. ChatGPT didn’t use it.
This exposed a few things:
Prompt quality matters. Even with a carefully worded question, the model defaulted to generalities.
The output gave me four helpful data points: 27% of ADV and 18% of notional are cleared, with nearly all interdealer trades centrally cleared — lower than the EU’s 43%.
For most users, this is more than enough. But for me (and probably you, if you're reading this), it's just the starting point.
Did ChatGPT give me anything I couldn’t get from a Google search? Honestly, no. So I moved on.
📊Step Two: Excel
ChatGPT provided a red rag to a bull at the end of its answer:
For more detailed and up-to-date information, you can refer to the SFTR public reports provided by DTCC and REGIS-TR.
Yeah, thanks. It’s the ChatGPT equivalent of LMGTFY:

I downloaded the reports myself and spent ~40 minutes “Exceling” the problem. I pulled in the latest weekly DTCC data and built a chart: 26% of the UK repo market is cleared.
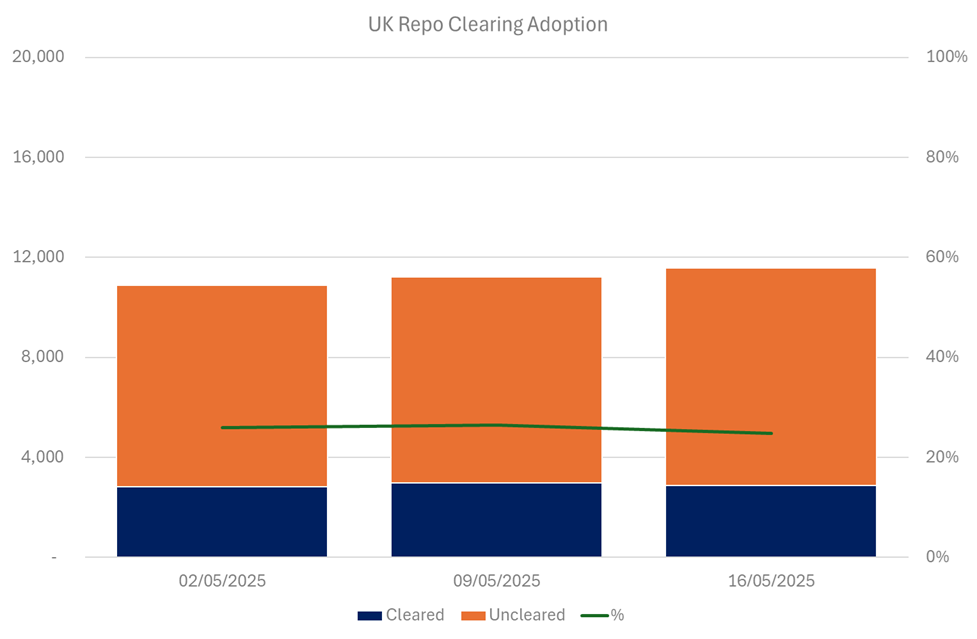
The chart above uses the three most recent weekly reports from DTCC, but working with the data revealed some flaws in the analysis;
There is no currency delineation. This applies to both the UK and EU SFTR data, so I decided to concentrate only on the UK data.
The UK data includes repos backed by all currencies — so not just Gilts, but also USTs, Bunds, and more.
That means ChatGPT’s assertion that “18–26% of the Gilt market is cleared” is wrong — it’s the repo market, not the Gilt-specific subset.
Would I have known that if I didn’t analyse the data myself? Probably not.
📐Understanding the data
There is a triangulation problem with SFTR data that it would be really nice to solve:
The public data is split into cleared and uncleared volumes. This is good!
There is no currency split, so we do not know what volumes are related to GBP Gilts, USD Treasuries, EUR Bunds/BTANs/BTPs etc.
We know the split between domestic versus cross-border flows. But we do not know whether a UK-based trade is facing the US, the EEA, Asia or elsewhere.
The DTCC even acknowledge this. Because of overlapping reporting obligations between UK and EU SFTR, you can’t combine both datasets to form a global view. For example, one trade might be reported to both.
And with no US equivalent of public SFTR data, we can’t triangulate against UST repo activity either.
One useful cross-check does exist: LCH RepoClear, which publishes monthly cleared volumes split by GBP and EUR. That gives us the “cleared” leg of the triangle — but not the total Gilt market, and not how much is reported under which SFTR regime.
Step Three: Code it up with ChatGPT
These days, I’m comfortable writing Python scripts with the help of an LLM. So I prompted:
Write a python script that I can run locally to download the UK SFTR data from the DTCC website here https://www.dtcc.com/repository-otc-data/sftr-public-reports-uk for the whole of 2025. Show a plotly chart of the total REPO volumes each week and the percentage cleared. Provide a scope for me to confirm first.
ChatGPT scoped the problem well. But the experience still wasn’t seamless:
403 errors: DTCC blocks scripted downloads. I had to manually fetch the data.
Context resets: ChatGPT sometimes forgot that I was running code locally, not inside its environment.
Control: The chart it created was okay. But the Excel reflex kicked in — I wanted to tweak colors, gridlines, axes. That’s still easier with a mouse in Excel than over text prompts.
Nevertheless, in a similar timeframe to my Excel project, I had the below chart:
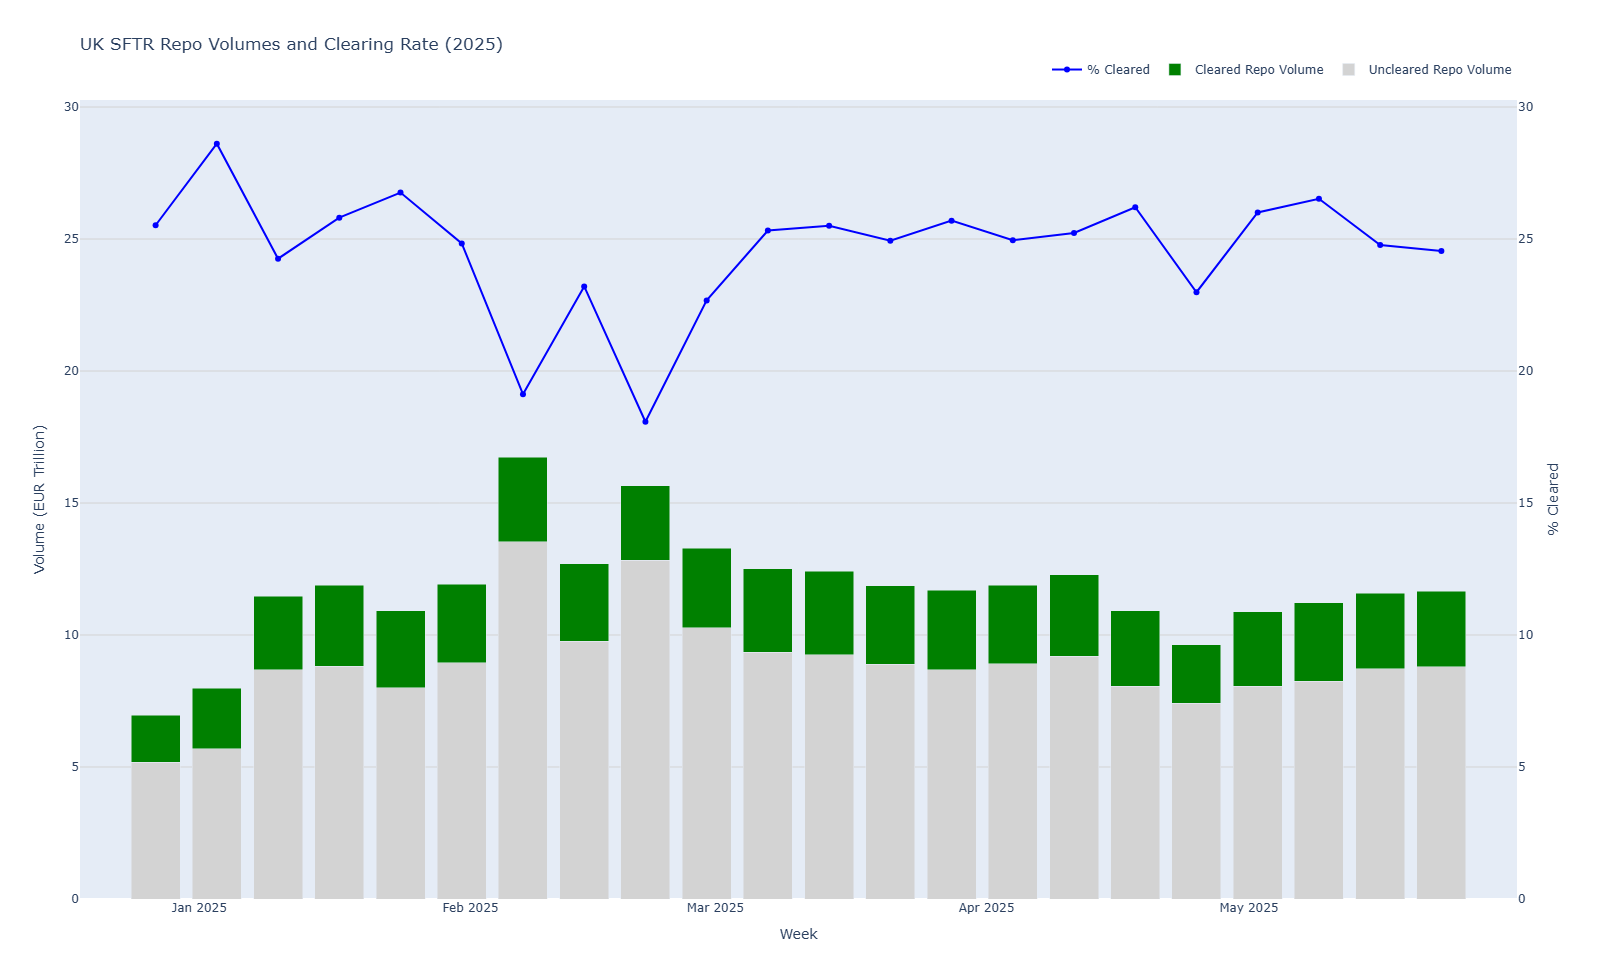
With more data, I can see that Clearing Adoption for UK market participants in Repo is relatively stable, but ranges from 18-28% for any particular week. There are no signs that clearing use dropped at year-end or quarter-end.
It is not a materially different answer to the ones provided by either ChatGPT or Excel. So why bother?
⚖️Pros and Cons
With my first look at repo data, I learned the following about researching with ChatGPT/LLMs;
Do: Ask LLMs for “quick answers”, which are sufficient for 90% of people, 90% of the time. I tend to live in the other 19% of use-cases. Maybe you do too!
Don’t: Discount LLMs because they get the answer wrong. By outsourcing coding to an LLM, I was able to get more data and conduct better analysis than using Excel alone.
Best: An ideal LLM would prompt back. “That is not a simple question buddy. Let’s look into the data together - Excel or Python today?”.
In Summary
Asking an LLM a question is not a shortcut to understanding data — it’s an invitation to explore it.
ChatGPT’s answer to “How much of the UK Gilt repo market is cleared?” wasn’t wrong, but it wasn’t right either. It wasn’t specific or nuanced. That’s a problem when data is messy, overlapping, incomplete etc.
Excel beats ChatGPT when it comes to engaging with the data….
…but coding with an LLM beats Excel, opening the door to analysing more data.
Combining Excel, Python, and ChatGPT — rather than choosing between them — provides the best of all three: fast answers, better charts, and a deeper understanding of the data.